Foreglow/Research
What manifestation-app reviews say about price and trust.
In 4,539 retrievable one- and two-star reviews, the recurring problem was not simply “people dislike paying.” It was the sequence around payment: personal setup before the price, limited value before a paywall, trial conversion, and difficulty understanding or ending a subscription.
Researched by Abhinav Chauhan · Updated 2 September 2026 · Corpus ends 27 July 20261,047 of 4,539 retrievable public one- and two-star reviews matched at least one pricing-friction code.
What did manifestation-app reviewers complain about most?
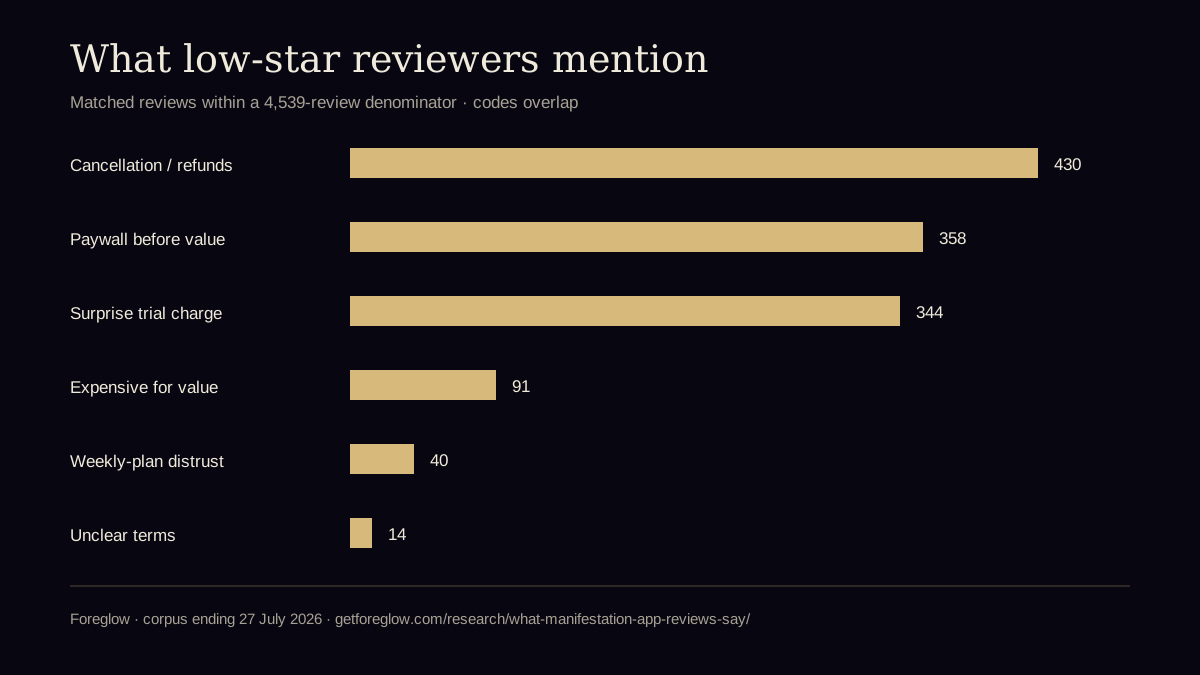
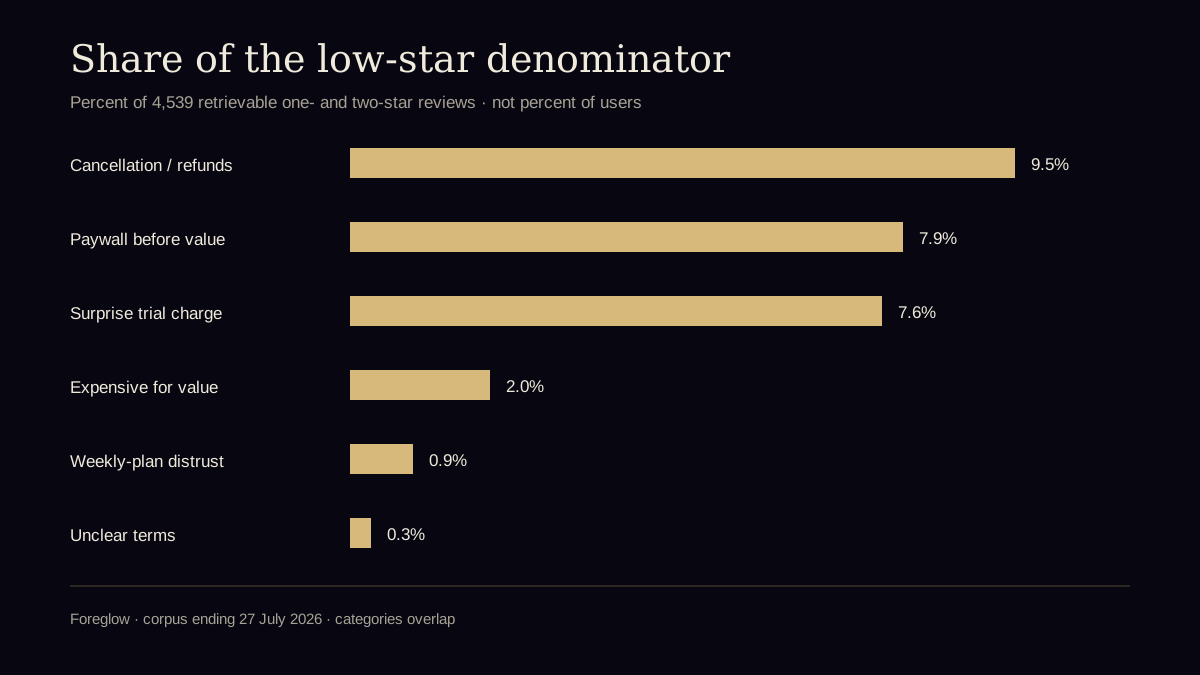
Among the pricing-related low-star reviews in this corpus, cancellation and refund difficulty was the largest coded theme at 430 reviews. Paywalls before value appeared in 358 reviews, and surprise charges after trials appeared in 344. These categories overlap, so their counts must not be added together or treated as shares of all app users.
The result in one table
| Theme | Matched reviews | Share of denominator |
|---|---|---|
| Cancellation or refunds are difficult | 430 | 9.5% |
| The paywall arrives before useful value | 358 | 7.9% |
| A free trial becomes a surprise charge | 344 | 7.6% |
| The subscription feels expensive for the value | 91 | 2.0% |
| Weekly subscriptions trigger distrust | 40 | 0.9% |
| Pricing or renewal terms are unclear | 14 | 0.3% |
The union of these codes is 1,047 reviews, or 23.1% of the 4,539-review denominator. The union counts each review once even when it contains several complaints. The rows do not: a person describing a trial charge and a failed refund can appear in both relevant rows.
Does this mean 23.1% of manifestation-app users have pricing problems?
No. The denominator contains retrievable public one- and two-star reviews, not users, customers, downloads or every rating. Store feeds have retrieval limits, platform coverage differs by app, and people who write reviews are self-selected. The 23.1% result describes this low-star-review corpus only; it cannot be converted into a population-wide complaint rate.
What was counted
The underlying research set contains 56,780 coded public reviews collected from Apple App Store and Google Play listings. Reviews span more than a decade, although coverage windows differ by product. Each record has a store, app identifier, review identifier, rating, date, source URL and retrieved text. The record total is parsed as CSV; it is not a line count, because review text can contain embedded line breaks.
For this analysis, the denominator was restricted to 4,539 retrievable one- and two-star reviews. Automated multi-label codes then marked reviews containing language associated with cancellation or refunds, expensive subscriptions, paywalls before useful value, pricing transparency, surprise trial charges and weekly subscriptions. A review can receive more than one code. The method is useful for finding repeated themes, not for deciding whether an individual review is correct.
What was deliberately not counted
- Star ratings without retrievable review text.
- Downloads, active users, paying subscribers or retention.
- Claims that a reviewer misunderstood or correctly understood a purchase screen.
- Revenue, conversion rates or refund rates for any competitor.
- Aya review statistics: Aya is absent from the research corpus, so its comparison page uses current store evidence only.
The strongest pattern is sequence, not price alone
A subscription can be expensive and still feel fair when the buyer understands it, sees useful value, and knows how to leave. The repeated failure sequence in these reviews is different: a person answers personal questions, reaches a paywall before receiving the promised result, starts a trial to avoid losing the work, later sees a charge, and then searches for cancellation or refund help while already frustrated.
That does not prove every app represented here uses the same flow. It does explain why several different complaint codes appear together. Trust is being evaluated across the whole journey, not only at the moment the price is shown.
Why do weekly app subscriptions attract complaints?
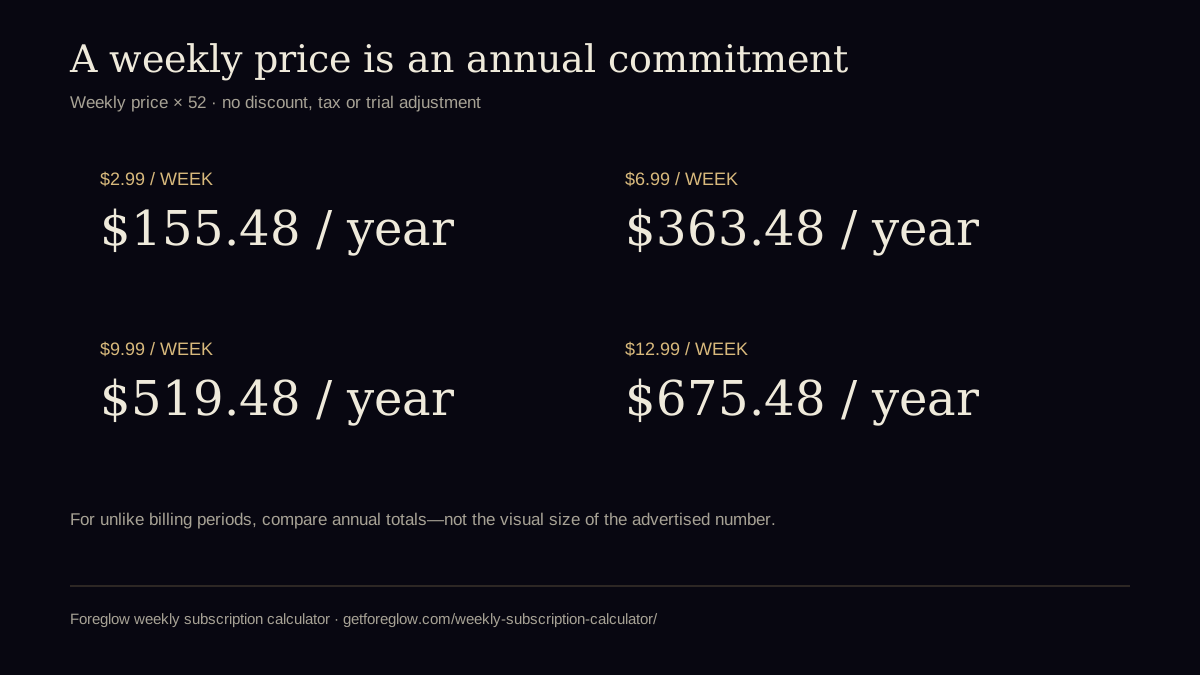
A weekly number looks smaller than its annual cost and requires multiplication to compare with monthly or yearly plans. For example, $9.99 per week is $519.48 across 52 weeks. Weekly billing can be appropriate for genuinely short-term use, but it becomes difficult to evaluate when a long-term app presents the weekly number more prominently than the annual total.
Foreglow's weekly subscription calculator performs that multiplication for any price and keeps the calculation in the browser. The tool is not evidence that every weekly subscription is deceptive. It is a way to make unlike billing periods comparable.
What positive reviews add to the picture
Low-star reviews reveal friction, but they cannot explain the whole category. Across the broader corpus, positive reviews repeatedly value content that feels personal rather than generic, audio that is easy to replay, visual reminders that stay visible, and simple routines that do not require a large time commitment. Those themes explain why people continue trying these products even when the category's pricing patterns create distrust.
The useful product question is therefore not “Can we remove payment?” It is “Can someone experience the core value before payment, understand the exact plan, and keep what they already made if they stop subscribing?”
How Foreglow applies the findings
- Price before personal intake. The current US prices are $9.99 monthly and $49.99 yearly, shown before the guided questions.
- Value before the paywall. The first personalised note is generated and playable before a purchase decision.
- No weekly plan. Monthly and yearly are the only subscription periods.
- Eligibility-aware trial disclosure. The monthly plan has no trial. The annual plan shows a seven-day introductory trial only when Apple's eligibility response says the person qualifies; ineligible people are not shown a trial promise.
- Created work stays usable. Existing notes remain playable after downgrade, and saved notes can be exported as ordinary audio files.
- Normal Apple cancellation. Subscription management and cancellation use the person's App Store subscription settings.
These are product rules, not proof of good outcomes. Foreglow is now live, and its public US listing confirms the free download plus $9.99 and $49.99 in-app purchase price points. The rules still matter only while the production app and each person's App Store purchase sheet continue to match them.
Is Foreglow free?
Foreglow is a free download with the first personalised future-self note free permanently. Its US App Store listing advertises optional Pro plans at $9.99 per month or $49.99 per year, with no weekly plan. The iPhone app is available now.
How to read any manifestation-app subscription page
- Find the billing period. “$6.99” is incomplete without weekly, monthly, yearly or one-time.
- Convert every option to one period. Compare annual totals rather than visual price size.
- Check what happens before payment. A sample is different from the personal result promised by onboarding.
- Read the trial line in the purchase sheet. Store eligibility and the renewal date matter more than generic website copy.
- Know where cancellation lives. On iPhone, subscriptions are normally managed in Apple Account subscription settings.
- Ask what remains after cancellation. Saved writing, recordings and exports can matter more than temporary access to new generation.
Download the aggregate evidence
These files contain aggregate counts and methodology only—no review text, reviewer names, account identifiers or review identifiers. The charts may be republished with attribution and the denominator intact.
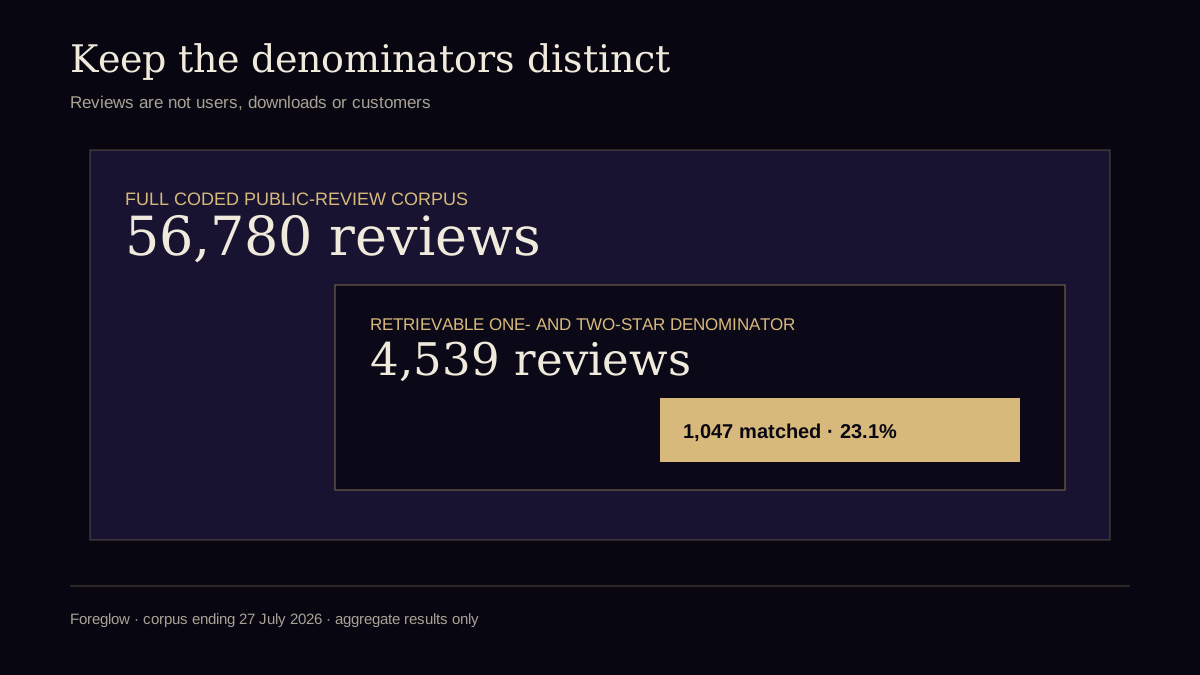
Foreglow's 2026 analysis found pricing-friction language in 1,047 of 4,539 retrievable public one- and two-star manifestation-app reviews (23.1%) within a broader corpus of 56,780 coded reviews. Categories overlap and the result is not a user complaint rate.
Review counts are not customer counts. Automated coding can misclassify individual text. Apple and Google expose different amounts of review history, so cross-app percentages are unsafe when platform mixtures differ. Recent slices can be extremely small. This page reports the full retrievable low-star denominator, names every numerator, and does not use the data to rank apps or predict outcomes.
Reproducibility and freshness
The figures above are tied to a corpus ending 27 July 2026 and were recomputed from the read-only coded dataset. Competitor prices and store ratings change independently of the corpus, which is why the current pricing comparison and individual app reviews carry separate verification dates. When a store fact changes, it should be updated without rewriting the historical corpus result.
If you quote the 23.1% figure, carry its denominator with it: 1,047 of 4,539 retrievable public one- and two-star reviews. Calling it “23.1% of users” would be false.
Corrections, updates and media use
We will correct arithmetic, labels or source descriptions without changing the historical corpus end date. A material recomputation will receive a new update date and an explanation here; it will not silently replace the denominator. Store prices and ratings live on separately dated comparison pages because they change more often than the research corpus.
Researchers, journalists and publishers may reuse the aggregate CSV and charts with a link to this page and an intact denominator. For a correction, source question or accessible chart format, email support@getforeglow.com. The full editorial methodology explains our source hierarchy, calculation rules and competing-product disclosure.